Grafana Stack Integration
Here you can find how to integrate the samba-exporter service with the prometheus monitoring stack.
Prometheus
To add this exporter to your prometheus database you have to add the endpoint as scrape job to the /etc/prometheus/prometheus.yml on your prometheus server. Therefor add the lines shown below:
  - job_name: 'Samba exporter node on server.local'
    metrics_path: metrics
    static_configs:
      - targets: ['server.local:9922']
Replace server.local with the network name of your samba server.
Attention When prometheus and samba-exporter are running on different instances you need to configure the samba-exporter service so it exposes the data on another interface then the loopback device. Therefore change the -web.listen-address in /etc/default/samba_exporter.
Grafana
For grafana an example dashboard is installed with the debian package and can be found at /usr/share/doc/samba-exporter/grafana/SambaService.json
Here is a screenshot of the example dashboard on a live system:
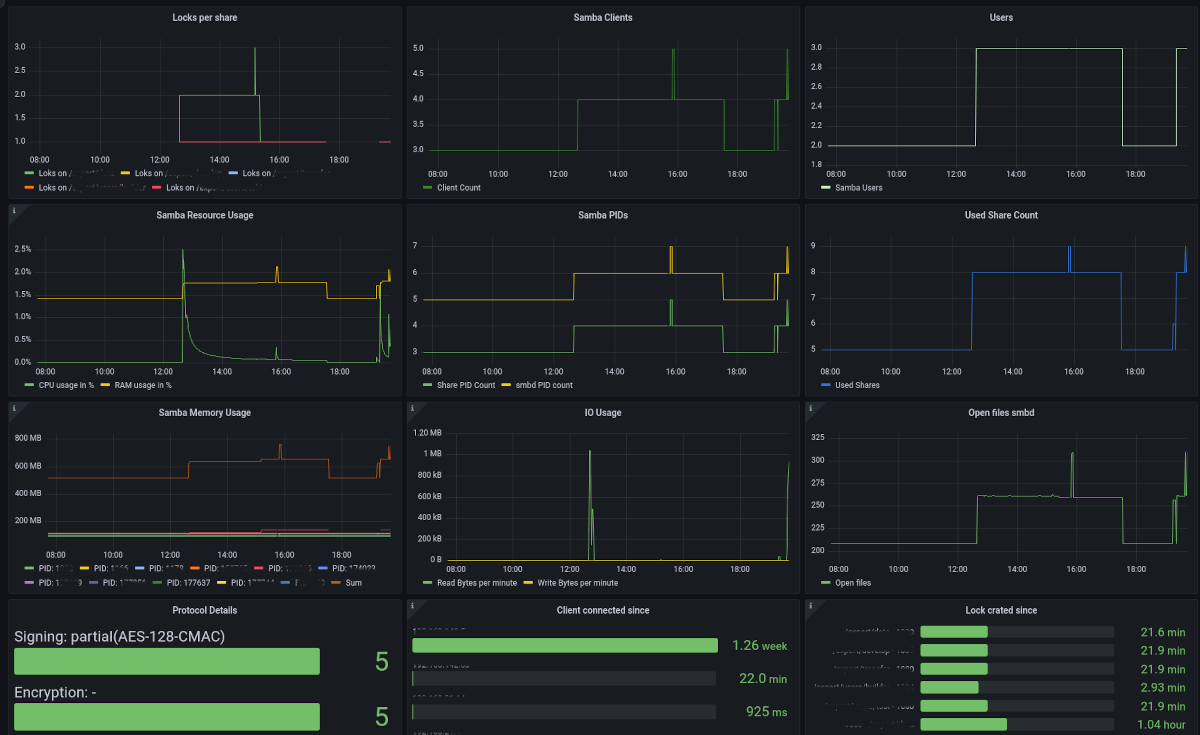
When importing this dashboard you need to change server.local to the network name of your samba server.
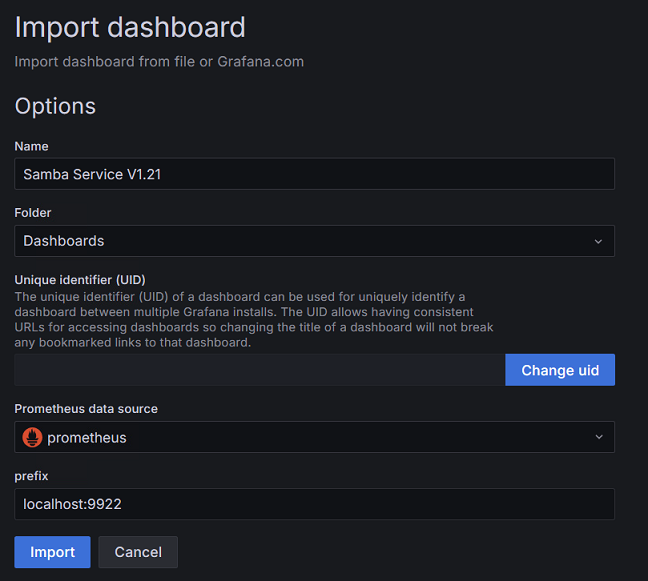
Here is a screenshot to import dashboard with this example json file SambaService.json, and you need to replace the prefix name server.local with the network name of your samba server, like localhost:9922.